PE Ratio, IPOs, Bonds & Volume: The Metrics Everyone Quotes but Few Explain Well


- PE ratio: the formula everyone agrees on
- The three-way disagreement on what a “good” PE ratio is
- What is an IPO?
- What are government bonds?
- Turnover ratio and trading volume
- Common mistakes with these metrics
- How to use these metrics: 4 practical steps
- Are these metrics worth learning? Weighing it honestly
- Conclusion: context beats a single number
Ask “what is PE ratio” and every result agrees on the formula: price per share divided by earnings per share. Ask whether a high PE ratio is good or bad, and the same search results disagree completely, sometimes from equally credible channels.
That disagreement is the actual story worth covering.
PE ratio: the formula everyone agrees on
“PE Ratio Explained Simply (With Examples)” (Everything Money, YouTube) covers the mechanical definition cleanly: price per share divided by earnings per share, a shorthand for how much investors are paying for each dollar of a company’s earnings. Where it gets genuinely contested is what counts as a “good” number.
The three-way disagreement on what a “good” PE ratio is
“Why a 15 P/E Ratio Is Fair Value For Most Companies” (FAST Graphs, YouTube) argues for a specific, moderate anchor number. “Charlie Munger: Why High PE Ratio Stocks Are Often The Best,” a third-party channel’s analysis of Munger’s public investing philosophy (The Long-Term Investor, YouTube), makes the opposite case: that a higher PE can reflect a genuinely superior business rather than overvaluation.
Warren Buffett’s own position on this general question, heavily influenced by Munger, was blunter than either video’s title: “It’s better to buy a wonderful company at a fair price than a fair company at a wonderful price” (Warren Buffett, Berkshire Hathaway’s 1989 shareholder letter).
Investor’s Business Daily’s “Stock Price To Earnings Ratio: Don’t Be Fooled By This Metric” (Investor’s Business Daily, YouTube) takes a third position entirely: that PE alone, in isolation, is a weak signal regardless of which number you treat as “fair.”
The current market backdrop makes this argument unusually alive. The S&P 500’s Shiller CAPE ratio (a cyclically adjusted PE measure) was running around 40–41 in July 2026, more than double its roughly 145-year historical average of about 17–18 and below only the December 1999 dot-com peak of 44.19 (Shiller CAPE data, multiple market-data aggregators, July 2026).
In that context, “15 is fair value” and “high PE is often fine” aren’t abstract positions. They can both be partly right because one is a broad valuation benchmark and the other is a company-specific principle. The real disagreement is over how much of a higher multiple can be justified by business quality and expected growth.
What is an IPO?
“What is an IPO? How to invest before a stock hits the market” (AJ Bell, YouTube) covers the initial public offering process (a private company offering shares to public investors for the first time) from a retail brokerage’s perspective, including the practical mechanics of applying for an allocation before the stock is trading freely.
What are government bonds?
“What are government bonds?” (IG UK, YouTube) and “What Are Government Bonds?—Economics Mastery Series” (tutor2u, YouTube) both cover the same basic structure: a government borrows from investors by issuing debt and repays principal according to the bond’s terms, usually with interest. Government bonds from financially strong sovereign issuers are generally considered lower-credit-risk than corporate debt, though not risk-free. Their prices still move with interest rates, while inflation, credit, liquidity, and currency risk can also matter.
Turnover ratio and trading volume
“Turnover Ratios—Meaning, Formula, Calculation & Interpretations” (WallStreetMojo, YouTube) and “Accounts Receivable Turnover Ratio” (Corporate Finance Institute, YouTube) both cover turnover ratio as a corporate-efficiency metric (how quickly a company cycles through assets, receivables, or inventory), which is a completely different concept from trading volume, even though the two get grouped together in search behavior. In other contexts, turnover can also refer to portfolio turnover or the rate at which a security’s available shares are traded, so the full term matters.
Trading volume, covered in “How to Use Volume for Day Trading” (Timothy Sykes, YouTube) and “How To Use Volume in Trading” (Mind Math Money, YouTube), is about how many shares or contracts are traded in a period: a market-activity signal, not a corporate-efficiency one. Confusing the two is an easy mistake given how similarly they’re named.
Common mistakes with these metrics
- Treating PE ratio as a standalone buy/sell signal. PE means very little without context on growth rate, sector, earnings quality, and debt load.
- Assuming there’s one universal “fair” PE number. 15 has been a traditional rule of thumb, but the Shiller CAPE data above shows the market has spent extended periods well above and below that level for structural reasons beyond simple mispricing.
- Confusing turnover ratio (a corporate efficiency metric) with trading volume (a market activity metric). They answer completely different questions.
- Buying an IPO purely because it’s new and popular. An IPO’s offer price reflects what the company, selling shareholders, and underwriters believe the market will pay, not necessarily fair value.
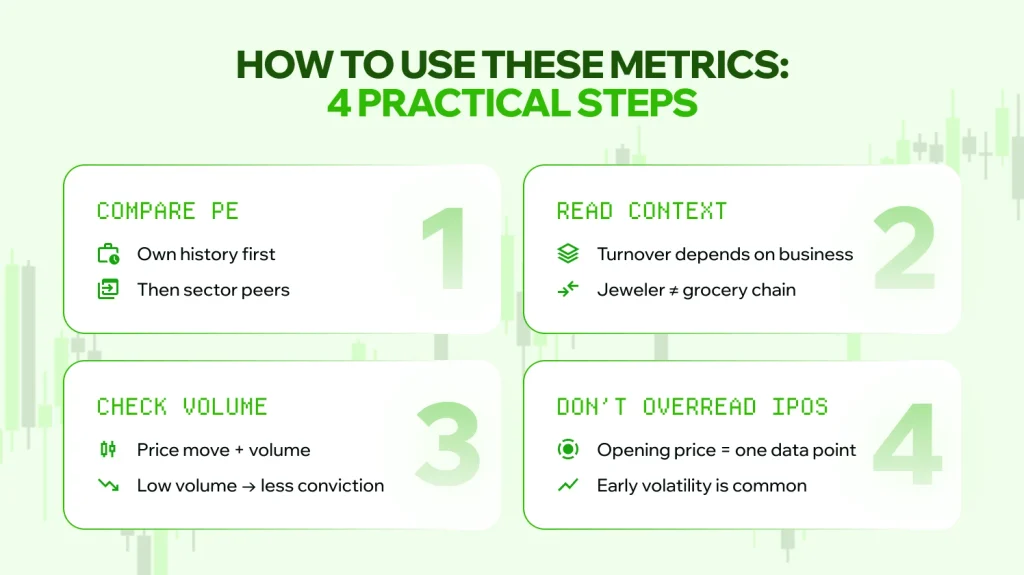
How to use these metrics: 4 practical steps
- Step 1. Compare a company’s PE ratio to its own history and its direct sector peers, not to a single universal benchmark number.
- Step 2. Check trading volume alongside any price move; a breakout or breakdown on low volume may carry less conviction, depending on the market and wider context.
- Step 3. Read a turnover ratio in the context of the business model; a low inventory turnover means something very different for a jeweler than for a grocery chain.
- Step 4. Treat an IPO’s opening price as one data point, not a verdict. Early volatility in newly listed shares is common and not necessarily informative.
Are these metrics worth learning? Weighing it honestly
The advantages: PE ratio, turnover ratio, trading volume, and bond yields are widely available and genuinely useful as context when read alongside relevant company, sector, and market data, though real-time or more detailed datasets may not always be free.
The limitations: Used alone, the PE ratio in particular is more contested than most beginner content admits. Credible sources disagree on what counts as “fair,” and the current market’s historically stretched valuation makes that disagreement more consequential than usual.
“Information access has improved massively, but the real challenge for any trader or investor hasn’t changed—it’s still distinguishing genuine signal from noise, whether that noise is a single ratio or a single headline.”
Vitalii Bulynin, CEO & Co-Founder, Versus Trade (paraphrased from FXStreet interview, July 15, 2026)
Conclusion: context beats a single number
PE ratio, IPOs, government bonds, turnover ratio, and trading volume are all genuinely useful tools, and all genuinely misused when treated as single numbers with a universal “good” or “bad” reading. The PE debate alone shows credible sources disagreeing sharply on the same metric, against a market backdrop where historical valuation benchmarks are more stretched than at almost any point in the last 145 years.
Learn what each metric actually measures, then read it against its own history and its peers rather than a rule of thumb from a single video.
Risk disclaimer: CFDs are high-risk instruments, and leverage can rapidly amplify losses. Available protections depend on the broker and jurisdiction. This article is educational content, not financial advice.
Explore the Versus Trade platform and discover the tools traders use to analyze markets, manage risk, and improve performance.

Note on sourcing: citations appear inline next to the claim they support. Video citations are based on each video’s title and description, not verbatim transcripts. Shiller CAPE data is drawn from multiple market-data aggregators reporting July 2026 readings against the approximately 145-year historical series. The quote about buying a wonderful company at a fair price appears in Warren Buffett’s 1989 Berkshire Hathaway shareholder letter and reflects an investment philosophy strongly influenced by Charlie Munger. The Versus Trade reference is paraphrased from a named, on-record interview (FXStreet, July 15, 2026), since the original remarks were reported in indirect speech.
- PE ratio: the formula everyone agrees on
- The three-way disagreement on what a “good” PE ratio is
- What is an IPO?
- What are government bonds?
- Turnover ratio and trading volume
- Common mistakes with these metrics
- How to use these metrics: 4 practical steps
- Are these metrics worth learning? Weighing it honestly
- Conclusion: context beats a single number