RSI Divergence and Support/Resistance Indicators: Do They Predict Reversals?


- What Divergence Means (And When It Fails)
- Support and Resistance: “The Only Strategy You Need”?
- The Research: What Do MACD Backtests Actually Show?
- What Indonesian Traders Are Watching
- Common Mistakes When Trading Divergence and Support/Resistance
- How to Trade These Signals: 4 Practical Steps
- Are These Tools Worth Using? Weighing It Honestly
- Conclusion: Confirmation Beats Conviction
Search “divergence pattern” or “support and resistance indicator” on YouTube and you’ll find two very different worlds living on the same results page. One world is calm and academic: definitions, textbook diagrams, and “here’s what RSI divergence looks like.” The other is loud: “the only support resistance strategy you need,” secret MACD settings, and indicators that promise to show you exactly where institutions are buying. Both are teaching the same handful of tools. Only one version tends to mention what happens when the signal is wrong.
What Divergence Means (And When It Fails)
Divergence happens when price and an oscillator, usually RSI or MACD, disagree. Price makes a new high, but the oscillator makes a lower high; that’s bearish divergence. Price makes a new low while the oscillator makes a higher low; that’s bullish. The logic is that momentum may be weakening even as price continues to extend the existing move.
Tutorials like “How To Trade The Bullish Divergence Pattern” (ForexSignals TV, YouTube) and “MACD Divergence Trading Strategy” (Mind Math Money, YouTube) walk through this cleanly, with textbook chart examples. Neither spends much time on the failure case: divergence can persist for a long time before price turns, and in a strong trend it can simply be wrong repeatedly before it’s finally right.
Spotting it also assumes you can already read the chart well enough to compare two swing highs or swing lows in price with the corresponding points on the oscillator. There is no single “divergent candle” that confirms the setup by itself.
Support and Resistance: “The Only Strategy You Need”?
Support and resistance form one of the oldest concepts in technical analysis: price often reacts around areas where it has reacted before. It’s also one of the most oversold ideas on YouTube: one popular upload is literally titled “The Only Support Resistance Trading Strategy You Need — Works Every Time!” (Forex Strategy Explorer, YouTube). TradingView’s own “RSI Divergence Indicator: Identify Momentum Shifts” (TradingView, YouTube) is more measured, framing the tool as one input among several rather than a standalone system.
If a channel labels its version a support and resistance indicator, a support resistance indicator, or an indicator support/resistance overlay, they’re all trying to identify areas where price may react, although the calculation method can differ considerably. Some use prior swing points, while others rely on pivots, moving averages, volume data, or algorithmically generated zones. The same broad principle appears in support and resistance forex trading, although currency markets have different liquidity structures and no centralized exchange volume.
The “works every time” framing doesn’t hold up against the classic technical analysis literature. John Murphy’s Technical Analysis of the Financial Markets and Edwards and Magee’s Technical Analysis of Stock Trends treat support and resistance as areas where reactions are more likely, not guaranteed turning points. Both discuss volume as useful confirmation, particularly for upside breakouts in exchange-traded markets. Neither establishes a universal rule that volume must rise by 50% or that every low-volume breakout is false. Volume also requires different interpretation in decentralized markets such as spot forex, where traders usually see tick volume rather than consolidated exchange volume.
The Research: What Do MACD Backtests Actually Show?
Most of the win-rate claims attached to divergence and MACD strategies online come from isolated or unverifiable backtests. A 2022 thesis posted on arXiv tested several MACD-based rules across constituents of the Dow Jones, Nasdaq, and S&P 500 using data from 2015 to 2021. It did not specifically test MACD divergence.
The results were mixed. Several crossover rules produced win rates below 50%, while a histogram-based rule reached roughly 66% to 68% but generated average losses larger than average gains. Combining MACD with RSI or the Money Flow Index improved win rates and risk-adjusted results within this particular backtest, although profitability remained less impressive and the study warned about period-specific results and possible overfitting (Pat Tong Chio, “A comparative study of the MACD-base trading strategies,” arXiv, 2022).
In plain terms, win rate alone does not show whether a strategy works. A system can win less than half the time and remain profitable if its average winner is large enough. It can also post a high win rate while losing money because its losing trades are much larger.
What Indonesian Traders Are Watching
This isn’t an English-language debate only. “Cara Paling Mudah Menentukan Support Dan Resistance” (Trader Misterius, YouTube) takes the plain-definition approach in Bahasa, while “Rahasia MASTAH Trader!” Cara JITU Menentukan Support Resistance” (Pintar Forex, YouTube), “the master trader’s secret,” uses the same hype framing as its English-language counterparts.
On the stock side, “Cara Membaca Divergence Trading Saham Menggunakan Indikator MACD,” part of a structured trading class series (Andy Senjaya, YouTube), applies MACD divergence directly to IDX-listed shares rather than forex pairs. That makes it more relevant if BBRI or INKP is on your watchlist.
Common Mistakes When Trading Divergence and Support/Resistance
- Treating divergence as a timing signal: divergence tells you momentum is fading, not when price will turn. It can persist for many candles before resolving.
- Ignoring available volume information: rising volume can strengthen the case for a breakout in exchange-traded markets, but low volume does not automatically invalidate the move. In spot forex, the available figure is generally tick volume rather than consolidated market volume.
- Drawing support/resistance as single lines instead of zones: price rarely respects a line to the pip; a zone gives a better read on where reactions cluster.
- Using divergence or an indicator as a standalone system: the cited backtest found mixed results for standalone MACD rules. Some combinations performed better in that particular test, but adding more indicators does not automatically improve a strategy or make the signals independent.
How to Trade These Signals: 4 Practical Steps
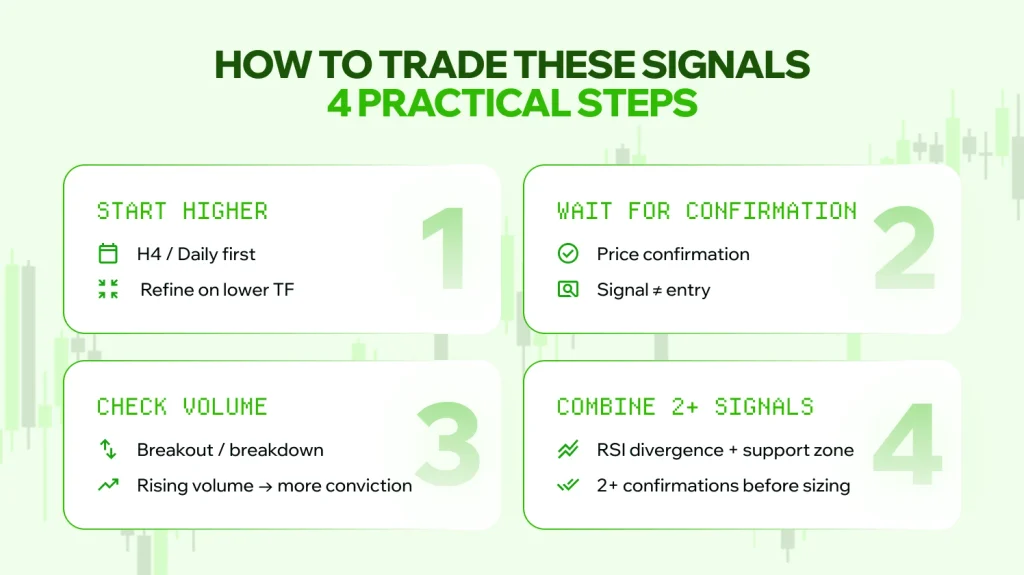
- Identify the divergence or level on a higher timeframe first (H4 or Daily), then drop down to refine your entry. Higher timeframes generally contain less short-term noise, although they can still produce false or late signals.
- Wait for price confirmation, not the indicator alone. A divergence or a level touch is a heads-up, not an entry signal on its own.
- Check available volume data on any breakout or breakdown. A breakout supported by rising exchange volume may carry more conviction, although volume behavior varies by market and is not a standalone confirmation rule.
- Combine at least two forms of confirmation, for example RSI divergence plus a support zone, before sizing a trade. One signal alone provides limited information about the quality and timing of a trade.
Are These Tools Worth Using? Weighing It Honestly
The Advantages: Divergence and support/resistance tools are widely available on charting platforms and can provide useful context without requiring specialized institutional data. Some combinations performed better in the cited backtest, but adding more indicators does not automatically improve a strategy or make the signals independent.
The Limitations: Used alone, individual indicators can generate frequent false or poorly timed signals. Support and resistance lines are subjective, and two traders will draw different zones on the same chart. And most of the most-viewed content skips the confirmation step entirely, because “wait for volume” is a less exciting thumbnail than “works every time.”
“AI is becoming the retail trader’s version of what HFT gave institutions — but there’s a real risk of it turning into a super signal provider that pushes everyone into the same trade at once.”
Vitalii Bulynin, CEO & Co-Founder, Versus Trade (paraphrased from FXStreet interview, July 15, 2026)
The same caution applies to any single indicator marketed as a sure thing, human-coded or AI-generated: when everyone is watching the same signal, the edge it once had tends to shrink.
Conclusion: Confirmation Beats Conviction
RSI divergence patterns and support/resistance levels aren’t broken tools; they’re some of the most-used ideas in technical analysis for a reason. But the research is consistent on one point that most tutorials skip: used alone, these signals do not provide consistently reliable reversal timing. Used alongside clearly defined price confirmation, risk controls, and testing across different market conditions, they may become more informative. The result still depends on the asset, timeframe, and exact trading rules. Learn to spot the divergence pattern, then spend at least as much time learning when to ignore it.
CFDs are complex instruments and come with a high risk of losing money due to leverage. This content is educational and should not be treated as financial advice.
Markets move fast. Get the flexibility to adjust your exposure and trade opportunities your way with leverage up to 1:2000.
- What Divergence Means (And When It Fails)
- Support and Resistance: “The Only Strategy You Need”?
- The Research: What Do MACD Backtests Actually Show?
- What Indonesian Traders Are Watching
- Common Mistakes When Trading Divergence and Support/Resistance
- How to Trade These Signals: 4 Practical Steps
- Are These Tools Worth Using? Weighing It Honestly
- Conclusion: Confirmation Beats Conviction