
Triangle Chart Pattern, Wedge & Cup-and-Handle: What Predicts a Breakout?


- What Is a Triangle Chart Pattern?
- Broadening Wedge (aka Megaphone Pattern): The Setup Traders Love to Fight About
- Cup and Handle: The One Pattern the Data Backs Up
- The Data at a Glance: How Each Pattern Performs
- What Indonesian Traders Are Charting
- Common Mistakes When Trading These Patterns
- How to Trade a Breakout Pattern: 4 Practical Steps
- Are Chart Patterns Worth Trading? Weighing It Honestly
- Conclusion: Trade the Statistics, Not the Thumbnail
Open YouTube, type “triangle chart pattern” into the search bar, and you’ll fall down a rabbit hole. One video promises a “high winning ratio” setup. The next one calls the same shape “the secret pattern” nobody’s telling you about. A third spends ten minutes explaining why the whole thing busted on them and cost real money. Same lines on the same charts, three completely different verdicts. If you’re trading out of Jakarta, Surabaya, or anywhere in between, sorting the signal from the noise matters more than memorizing another shape.
Let’s get into what a symmetrical triangle pattern, a broadening wedge, and a cup and handle pattern are; why the creators teaching them disagree so often; and, because opinions are cheap, what the largest publicly available statistical study of chart patterns says happens after the breakout.
What Is a Triangle Chart Pattern?
A triangle chart pattern forms when price gets squeezed between two converging trendlines. That’s the whole definition. If a tutorial calls it a chart triangle, a symmetrical triangle chart pattern, or simply “the triangle thing,” the mechanics underneath are identical. Only the direction of the squeeze changes, and that direction is what separates the three versions traders search for constantly:
- Ascending triangle: flat resistance on top, rising support underneath. Buyers keep showing up earlier each time, and the textbook read is a bullish breakout.
- Descending triangle: flat support on the bottom, falling resistance above. The mirror image is generally read as bearish.
- Symmetrical triangle: both lines converge toward each other at roughly the same angle. Neither side is winning yet, which is exactly why it’s the most argued-about of the three.
Here’s where the disagreement starts. Plenty of tutorials, like the entry-and-exit breakdown “How To Trade The Symmetrical Triangle Pattern” (ForexSignals TV, YouTube), walk through clean, textbook setups and make the pattern look mechanical: draw the lines, wait for the break, take the trade. “Ascending and Descending Triangles Explained in 7 Minutes” (Mind Math Money, YouTube) does the same thing from the definition side. What almost none of these explainers mention is what happens when the pattern doesn’t do what it’s supposed to.
That’s not a small gap. Trader and author Thomas Bulkowski has run the only large-sample, publicly documented statistical study of chart pattern performance available for free online, tracking thousands of “perfect” trades across decades of price data. His numbers tell three different stories depending on which triangle you’re looking at: the ascending triangle ranks a respectable 16th out of 39 bullish patterns with a 17% failure rate on upward breakouts; the descending triangle is more balanced at 22%/23%; but the symmetrical triangle, the version most tutorials default to, ranks 36th out of 39, with failure rates of 25% (up) and 37% (down), and downward breakouts reverse hard (“bust”) roughly 48% of the time in bull markets (Source: thepatternsite.com, Bulkowski on Ascending Triangles, Descending Triangles, and Busted Symmetrical Triangles). In other words, the most popular triangle to teach is statistically the weakest of the three.
Broadening Wedge (aka Megaphone Pattern): The Setup Traders Love to Fight About
If triangles squeeze, the broadening wedge does the opposite: support and resistance widen out into a megaphone shape as volatility expands instead of contracting. You’ll see it described as an ascending broadening wedge, a descending broadening wedge, or a right-angled variant depending on which line is flat. Each broadening pattern behaves differently depending on breakout direction, which is part of why traders disagree so often about them.
The content around this pattern splits into two camps almost perfectly. One side, like “Ascending Broadening Wedge Pattern | High Winning Ratio” (ForexBee, YouTube), teaches it as a high-probability reversal setup with clean entries and stop placement. On the other side, a widely watched Portuguese-language breakdown translated as “3 Broadening Patterns That Actually Works” (O Cara do Mercado, YouTube) spends most of its runtime pointing out where the popular version of this trade goes wrong.
Bulkowski’s own data lands closer to the skeptical side: the ascending broadening wedge fails 15% of the time on upward breakouts but 31% of the time on downward ones, and the descending version is worse in both directions (18%/35%) (thepatternsite.com, Bulkowski on the Ascending and Descending Broadening Wedge). Read literally, the “high winning ratio” claim only holds for one breakout direction of one variant, not the pattern family as a whole.
Cup and Handle: The One Pattern the Data Backs Up
Quick, practical note before we get into it: if you search “CNH pattern” expecting cup-and-handle content, you’ll wade through sewing tutorials and craft patterns before you hit a single chart. “CNH” is shorthand traders use for cup and handle, but it’s also a common abbreviation in totally unrelated corners of the internet. Search “cup and handle pattern” instead and you’ll get where you’re going faster.
The pattern itself is a rounded consolidation (the “cup”) followed by a smaller pullback (the “handle”) before a continuation move. It’s a favorite in both stock and crypto tutorials, and it shows up regularly in Indonesian-language content too. “Cup and Handle Pattern Cara Entry Setup SL TP” (Iyanto Channel, YouTube) walks through entries and stop-loss placement on this specific pattern, alongside broader candlestick-reading guides like “Cara Baca Candlestick” (InvestasiKu by Mega Capital Sekuritas, YouTube) aimed at local retail traders.
Here’s the twist: unlike the symmetrical triangle, the hype around the cup and handle is largely justified. Bulkowski ranks it 3rd out of 39 bullish patterns, near the top of the entire list, with only a 5% failure rate on upward breakouts (thepatternsite.com, Bulkowski on the Cup with Handle). Of the three patterns covered in this piece, it’s the only one where “this works” and “the statistics back it up” point in the same direction.
The Data at a Glance: How Each Pattern Performs
All figures below come from Thomas Bulkowski’s bull-market pattern research, based on over 1,000 tracked “perfect” trades per pattern in most cases. Lower rank numbers are better.
| Pattern | Bull-Market Rank* | Up-Breakout Failure | Down-Breakout Failure | Source |
| Cup and Handle | #3 of 39 | 5% | n/a** | thepatternsite.com |
| Ascending Triangle | #16 / #30 | 17% | 38% | thepatternsite.com |
| Descending Triangle | #33 / #15 | 22% | 23% | thepatternsite.com |
| Symmetrical Triangle | #36 of 39 | 25% | 37% | thepatternsite.com |
| Ascending Broadening Wedge | — | 15% | 31% | thepatternsite.com |
| Descending Broadening Wedge | — | 18% | 35% | thepatternsite.com |
*Rank is out of 39 bullish patterns Bulkowski tracks (up-breakout rank shown; two numbers indicate separate up/down rankings on different scales). The cup and handle is measured only for upward breakouts, as it is a bullish continuation pattern.
What Indonesian Traders Are Charting
A good chunk of this pattern content isn’t generic. Search around “symmetrical triangle” in Bahasa Indonesia, and you’ll find breakdowns applied directly to IDX-listed names: a symmetrical triangle flagged on INKP (Indah Kiat Pulp & Paper) with a specific profit target in the “Watchlist Saham” series (Andy Senjaya, YouTube); a live trading session built around BBRI position sizing in the billions of rupiah (Astronacci, YouTube); and “Jenis-jenis Chart Pattern untuk Trading Saham,” featuring analyst Michael Yeoh (Stockbit, YouTube), aimed at people trading the local exchange rather than EUR/USD on a demo account.
If you’re trading IHSG names during Jakarta hours, that local content is often more directly useful than another generic forex-pair example.
Common Mistakes When Trading These Patterns
- Trading the pattern before it’s confirmed: A triangle isn’t “complete” until the price closes through the trendline, not when it merely touches it. Jumping in early is the single most common warning across the tutorials that bother to cover failure cases at all.
- Ignoring volume on the breakout: Bulkowski’s identification guidelines (thepatternsite.com) note that volume trends downward through most triangle formations roughly 78% of the time, and a breakout without a volume pickup is more likely to be one of his “busted” patterns than a real move.
- Assuming every triangle resolves in the direction of the prior trend: Symmetrical triangles in particular have a notably high reversal rate, and treating them as automatic continuation setups is how “sure thing” trades turn into stopped-out ones.
- Skipping the invalidation level: If you don’t know the exact price where the pattern is proven wrong before you enter, you’re not trading a setup. You’re guessing with extra steps.
How to Trade a Breakout Pattern: 4 Practical Steps
- Step 1: Identify and draw the lines cleanly. Use closing prices, not wicks, to draw your trendlines. Messy lines produce messy signals.
- Step 2: Wait for a confirmed close beyond the line, not a mere touch. This alone filters out a large share of the premature breakouts and breakdowns that make these patterns look worse than a clean setup is.
- Step 3: Check volume and momentum before entering. A breakout with a volume spike behind it and supporting momentum on RSI or MACD is a different trade than a break on a quiet afternoon.
- Step 4: Set your invalidation level first, then your position size. Decide where you’re wrong before you decide how much you’re risking, not after.
Are Chart Patterns Worth Trading? Weighing It Honestly
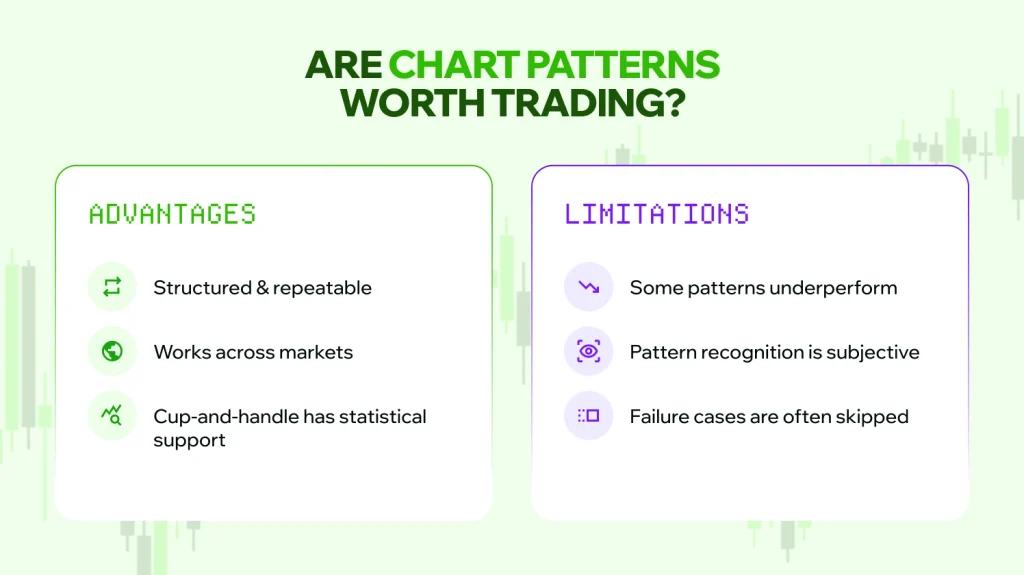
The Advantages: Chart patterns give you a structured, repeatable way to read price action instead of guessing. They translate well across markets. The same triangle logic applies if you’re watching forex pairs, IDX stocks, or crypto. And per the data above, at least one of the commonly taught patterns (cup and handle) has real statistical support beyond its popularity.
The Limitations: Some of the most commonly taught patterns, especially symmetrical triangles, perform worse than their popularity suggests once someone runs the numbers. Pattern recognition is also subjective; two traders can look at the same chart and draw different lines. And a huge share of the content teaching these setups skips the failure cases entirely, which leaves beginners trading a pattern’s reputation instead of its track record.
CEO & Co-Founder, Versus Trade – Vitalii Bulynin
(FinanceFeeds interview, June 12, 2026)
Bulynin’s point, made in the context of trading education generally, applies directly here: the shapes themselves aren’t complicated. What takes work is learning which ones the data supports and trading them with a plan for when you’re wrong.
As Jesse Livermore put it almost a century ago, “There is nothing new on Wall Street. There can’t be because speculation is as old as the hills” (Reminiscences of a Stock Operator, Edwin Lefèvre, 1923). The patterns aren’t new either. What’s new is how much content now exists teaching only the half of the story that gets clicks.
Conclusion: Trade the Statistics, Not the Thumbnail
Triangle chart pattern, wedge, and cup-and-handle setups aren’t scams, and they aren’t magic. They’re a starting point for reading price structure, and the data above shows some are simply better-tested starting points than others. The traders who do well with them aren’t the ones who found the “secret” version of a weak pattern. They’re the ones who wait for confirmation; check volume; know their invalidation level before they enter; and adjust their conviction based on which setups the numbers back, a cup and handle over a symmetrical triangle, for instance, if history is any guide.
CFDs are complex instruments and come with a high risk of losing money due to leverage. This content is educational and should not be treated as financial advice.
Try strategies, explore MT5 and get a feel for the markets with a demo account before putting real capital on the line.

- What Is a Triangle Chart Pattern?
- Broadening Wedge (aka Megaphone Pattern): The Setup Traders Love to Fight About
- Cup and Handle: The One Pattern the Data Backs Up
- The Data at a Glance: How Each Pattern Performs
- What Indonesian Traders Are Charting
- Common Mistakes When Trading These Patterns
- How to Trade a Breakout Pattern: 4 Practical Steps
- Are Chart Patterns Worth Trading? Weighing It Honestly
- Conclusion: Trade the Statistics, Not the Thumbnail